Six months into 2016 and new-vehicle registrations are running 5.3 per cent up on the same period last year. But remember, that’s registrations, not sales.
The New Zealand Transport Agency (NZTA) doesn’t record actual sales, only registrations. Its monthly numbers are picked up by the Motor Industry Association (MIA), the distributors’ representative.
The MIA said 69,057 new vehicles were registered to the end of June, compared to 65,653 for the same period last year. So far that’s roughly 500 more vehicles a month in 2016.
But how many of the 69,057 were pre-registrations? Those registered by distributors and dealers before they were actually sold to an end user? Some are still waiting to be sold, in many cases months after they appeared on the NZTA books as registered.
It’s industry practice, what distributors and dealers do. Have done for years. It’s discounting by another name. It allows salesmen to say, ‘Boy, have we got a deal for you. It’s a demo. Hardly driven. Ony a few kays on the clock.’
Most industry executives say the more pre-registrations a carmaker logs, the more it devalues the brand. Some go as far as to say that a new vehicle registered by a dealer in April, for example, and sold with a few kays on the clock in June, is essentially second-hand.
The average punter thinks of registrations as sales, especially when the NZTA and MIA talk record numbers because of flush immigration figures, and a healthy economy. The truth is, pre-registrations falsely inflate numbers.
So let’s take a look at who’s doing what with pre-registrations of passenger cars and/or light commercials in the first six months of 2016. The first figure is the NZTA record of a carmaker’s registrations, the second dealer and/or distributor pre-registrations, or ‘demonstrators’, the third percentage of such.
Toyota: 11,583 ………. 998………. 8.6%
Ford: 8230 ……… 1604 ………19.4%
Holden: 6212 ……… 1515 ……… 24.3%
Mazda: 5434 ……… 907 ……… 17.2%
Mitsubishi: 4519 ……… 835 ……… 18.4%
Hyundai: 4200 ……… 1172 ……… 27.8%
Nissan: 4082 ……… 584 ……… 14.3%
Suzuki: 2668 ……… 478 ……… 17.9%
Volkswagen: 2540 ……… 854 ……… 33.6%
Kia: 2481 ………446 ……… 17.9%
Honda: 1868 ……… 275 ……… 14.7%
M-Benz: 1504 ……… 472 ……… 31.3%
Subaru: 1341 ……… 338 ……… 25.2%
Isuzu: 1293 ……… 268 ……… 20.7%
Ssangyong: 1128 ……… 192 ……… 17.0%
BMW: 962 ……… 510 ……… 53.1%
Audi: 918 ……… 297 ……… 32.3%
Land Rover: 718 ……… 174 ……… 24.2%
Skoda: 690 ……… 182 ……… 26.3%
Jeep: 552 ……… 239 ……… 43.2%
Peugeot: 445 ……… 157 ……… 35.2%
Lexus: 331 ……… 122 ……… 36.8%
Volvo: 314 ……… 132 ……… 42.0%
Mini: 285 ……… 147 ……… 51.5%
Dodge: 225 ……… 82 ……… 36.4%
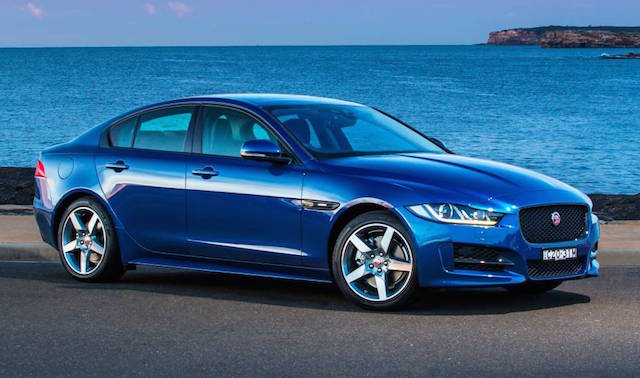
Jaguar: 163 ……… 94 ……… 57.6%
Citroen: 137 ……… 27 ……… 19.7%
Renault: 105 ……… 41 ……… 39.0%
Alfa Romeo: 84 ……… 46 ……… 54.7%
As you can see, Jaguar’s pre-registrations are the highest, with 5.7 cars out of every 10 on the NZTA books so far this year registered by the distributor and/or dealers as demonstrators. Next is Alfa Romeo, with 5.5 out of every 10, followed by BMW with 5.3 and Mini 5.1. Volvo and Jeep pre-register upwards of four out of every 10. Renault, Dodge, Lexus, Peugeot, Volkswagen, Audi, and Mercedes-Benz pre-register between 3 and 4. The rest in this chart registered between 0.8 (Toyota) and 3 cars in every 10 as demonstrators.
