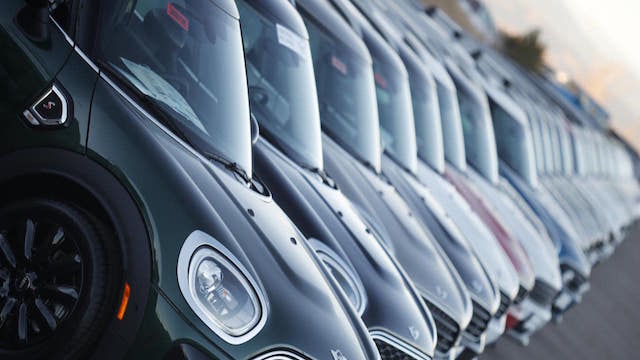
There were a record 161,495 new vehicles registered with the NZ Transport Agency (NZTA) in 2018 … but there is nothing on government records to show that almost 20 per cent were actually sold.
Confidential records show that 31,567 of the 161,495 were registered not by actual buyers, but by the people selling them: dealers and/or distributors. They therefore registered to themselves an average of 607 vehicles a week last year.
What happened to them after they were registered is a mystery. The NZTA can’t tell you. Nor can the Motor Industry Association, the distributors’ representative.
Were they sold as near-new ‘demonstrators’? Are they still sitting in dealerships? Are they being driven by distributors’ staff? Or have they been sold as low-mileage ‘used’ stock?
How many of the electric vehicles (EVs) figured in the pre-registered numbers? The EV industry constantly talks about the uptake of zero emission cars and vans: around 12,000 used and new, it says.
But there is no evidence that 12,000 are actually on the road – only that 12,000 have been registered.
The EV industry here uses the growth of EVs in Norway as a benchmark. But Norway’s transport regulators register a vehicle – EV, petrol or diesel – only when it is actually sold to an end user.
This from the office of the secretary general of the Norwegian EV Association: “In Norway, car sales are registered only when the cars are delivered to the customer. Seems a bit strange how it is done in New Zealand.”
Here are the 2018 pre-registration figures for mainstream brands in NZ. Again, 161,495 new vehicles were registered with the NZTA, 31,567 of which were first registered to distributors and/or dealers.
The first number is the total registered with the NZTA, the second is those first registered by the distributor and/or dealer (breakdown in brackets), the third is the percentage of first registrations.
Audi 1811 – 713 (709 dealer, 4 distributor) – 39%
BMW 1649 – 892 (880 dealer, 12 dist) – 54%
Citroen 234 – 84 (79 dealer, 5 dist) – 36%
Fiat 1158 – 115 (111 dealer, 4 dist) –10%
Ford 16,364 – 3949 (2655 dealer, 1294 dist) – 24%
Holden 13,045 – 2982 (2627 dealer, 355 dist) – 23%
Honda 5293 – 430 (161 dealer, 269 dist) – 8%
Hyundai 8097 – 2219 (977 dealer, 1242 dist) – 27%
Isuzu 2548 – 606 (336 dealer, 270 dist) – 24%
Jaguar 409 – 202 (150 dealer, 52 dist) – 49%
Jeep 1559 – 664 (396 dealer, 268 dist) – 42%
Kia 6882 – 1117 (1021 dealer, 96 dist) – 16%
Land Rover 1067 – 392 (336 dealer, 56 dist) – 37%
LDV 1988 – 155 (155 dealer, 0 dist) – 8%
Lexus 808 – 403 (342 dealer, 61 dist) – 50%
Mazda 12,236 – 2208 (1986 dealer, 222 dist) – 18%
Mercedes-Benz 3679 – 1072 (939 dealer, 133 dist) – 29%
Mini 607 – 221 (221 dealer, 0 dist) – 36%
Mitsubishi 12,317 – 2583 (1949 dealer, 634 dist) – 21%
Nissan 8309 – 1346 (1233 dealer, 113 dist) – 16%
Peugeot 933 – 333 (323 dealer, 10 dist) – 36%
Porsche 347 – 94 (86 dealer, 8 dist) – 27%
Renault 507 – 142 (128 dealer, 14 dist) – 28%
Skoda 1575 – 568 (338 dealer, 230 dist) – 36%
Ssangyong 1059 – 204 (60 dealer, 144 dist) – 19%
Subaru 3631 – 743 (625 dealer, 118 dist) – 20%
Suzuki 6518 – 1126 (846 dealer, 280 dist) – 17%
Toyota 32,259 – 3017 (2440 dealer, 577 dist) – 9%
Volkswagen 5908 – 1858 (1565 dealer, 293 dist) – 31%
Volvo 638 – 304 (237 dealer, 67 dist) – 48%
