Road deaths in New Zealand this year are shaping to average around 80 for every million inhabitants, the gloomiest statistic since the average 86 in 2010.
The road toll going into the second week of November stood at 323, compared to 274 at the same time last year.
That’s a monthly average in 2017 of almost 32 deaths against 27 last year. Driver deaths were up 26 per cent, to 170 from 135.
Fatal crashes to November 6, say Ministry of Transport statistics, were up 22 per cent, from 237 last year to 289.
In the years 2011-2016, an average 70 people out of every one million in NZ died on our roads. In Australia, the average over the seven years was 54. In Norway, it was 34.
2010 – road toll 375, NZ population 4.35m – average 86 deaths per million
2011 – road toll 284, NZ population 4.38m – average 65 deaths per million
2012 – road toll 308, NZ population 4.40m – average 70 deaths per million
2013 – road toll 253, NZ population 4.44m – average 57 deaths per million
2014 – road toll 293, NZ population 4.51m – average 65 deaths per million
2015 – road toll 319, NZ population 4.59m – average 70 deaths per million
2016 – road toll 328, NZ population 4.69m – average 70 deaths per million
2017 – road toll … NZ population 4.71m – average … deaths per million
The fewest road deaths in the European Union in 2016 were those in Norway and Switzerland, with 26 per 1 million inhabitants, followed by Sweden and Great Britain, with under 30 per 1 million.
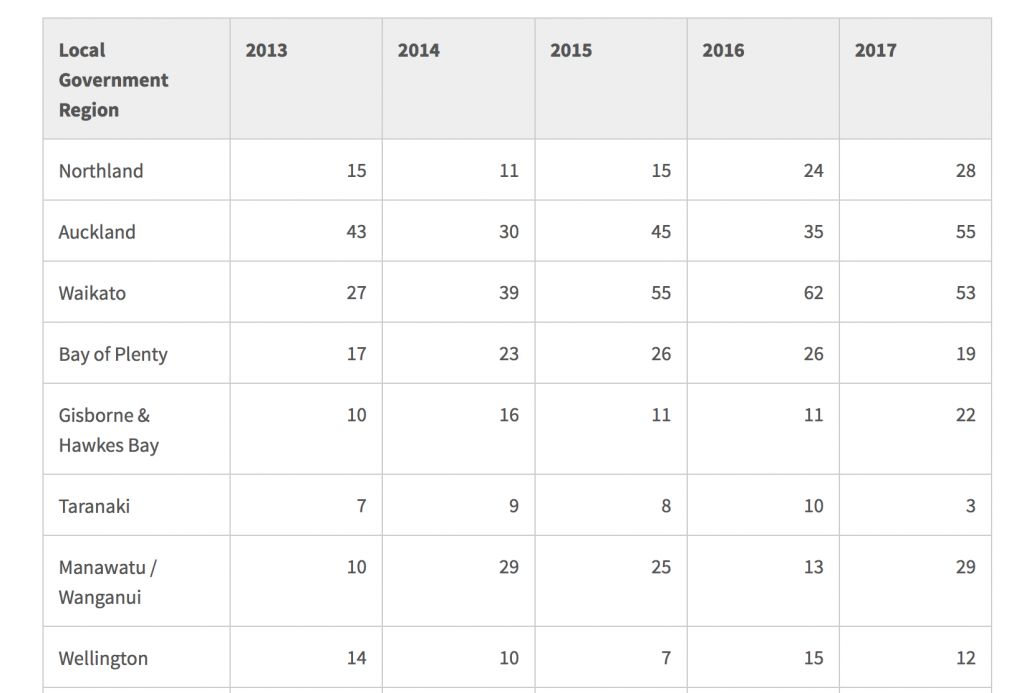
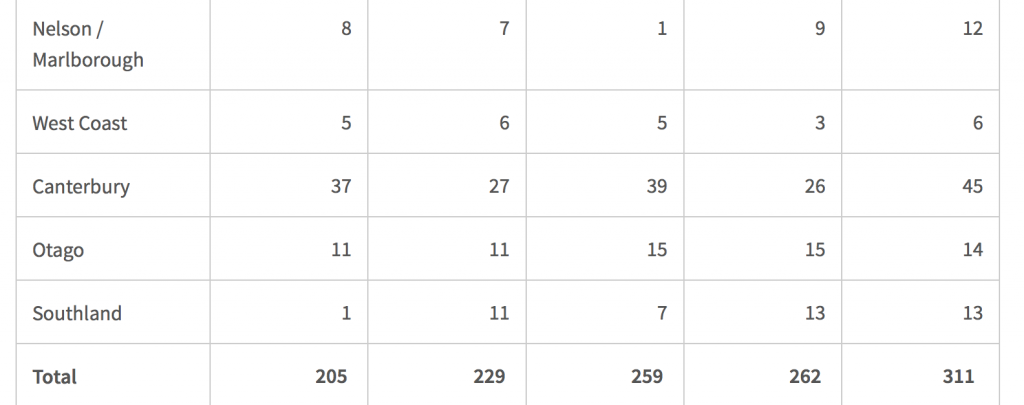
Regional deaths in NZ in past 5 years.


