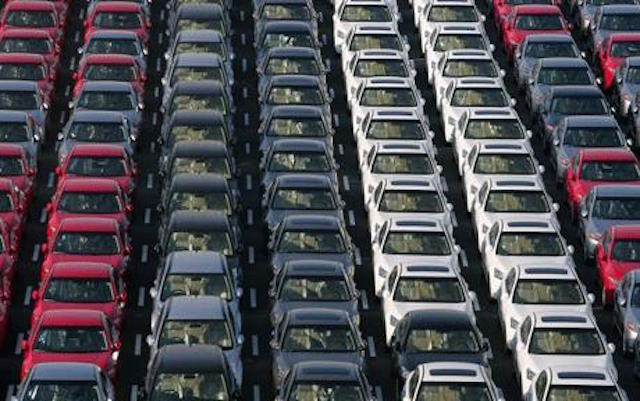
The new vehicle industry in New Zealand is heading for its first annual sales slump since the Global Financial Crisis (GFC) bit deep 10 years ago.
Registrations of new cars and commercials at the end of August were down 5.1% on the same eight-month period last year, the first sign in a decade that the car market – long this country’s economic barometer – is feeling some pain.
The 5.1% drop means registrations so far this year are down an average of around 160 new vehicles a week – or 650 a month – on 2018.
It in turn means a roughly $20 million loss in turnover for the industry each month, based simply on a conservative average price of between $30,000 and $35,000 a vehicle.
The last time numbers went into reverse was in a calamitous 2009, when, in the mire of the GFC, new vehicle registrations for the year plummeted to 70,048 units, down 28.0% on the 97,330 logged in 2008.
The market bounced back in 2010, with 80,453 registrations, up 14.8% on 2009. The trend continued in 2011, this time with more modest growth of 5.2% (84,640).
Signs that the best was yet to come for the new car industry appeared in 2012 when 100,795 new vehicles were registered, up 19.0% – an unprecedented jump – on 2011.
But that hike has never been repeated. The years 2012-2013 and 2013-2014 came closest, when registrations were up over 12.0% year-on-year. Last year they were up only 1.0% on 2017.
Now, carmakers are bracing for tougher times ahead. No one wants to go on the record, but a straw poll of a handful of industry executives points to more pain.
Said one, who is burdened with excess stock in a slowing market, looking to discount much of it, and has new models on the way: “At the risk of being seen as just talking up our industry, now is the best time to buy a new car.
“They are going to cost more – no doubt about that. Everyone in the industry is facing increased costs: the real estate boom means dealers on leased sites are paying more; wages are up for service technicians … but margins on vehicles haven’t gone up.
“The bottom line is we’re selling fewer new cars at a time when we are forced to absorb additonal costs. And we are going to sell fewer cars still.”
The value of the New Zealand dollar figures in all discussions. In 2016, when car registrations here broke for the first time through the 160,000 barrier, the dollar was trading at US70 cents, 80 Japanese yen, 60 euro cents.
Now the dollar is at US63 cents, nearly as weak as it was this month 10 years ago – during the GFC – when it was at US62 cents. As for Japan, the dollar is at 68 yen; it’s dropped against the Euro, too. Who knows what Brexit will bring? How Trump’s trade war with China will pan out?
So what happened to the car market in 2009? Let’s start with this year first.
- To repeat, at the end of last month registrations were down 5.1% on the same eight-month period in 2018.
- At the end of August 2009 they were down more than 31.0% on the same period in 2008.
For the record, here’s how the 15 mainstream car brands fared 10 years ago.
AUDI: 787 registrations Jan-Aug 2008 – 717 Jan-Aug 2009: down 9.0%
BMW: 719 Jan-Aug 2008 – 631 Jan-Aug 2009: down 12.0%
FORD: 5257 Jan-Aug 2008 – 4031 Jan-Aug 2009: down 23.0%
HOLDEN: 4901 Jan-Aug 2008 – 3331 Jan-Aug 2009: down 32.0%
HONDA: 3884 Jan-Aug 2008 – 2050 Jan-Aug 2009: down 47.0%
HYUNDAI: 3036 Jan-Aug 2008 – 3052 Jan-Aug 2009: up 0.5%
KIA: 1382 Jan-Aug 2008 – 1381 Jan-Aug 2009: 0.0%
MAZDA: 3775 Jan-Aug 2008 – 3003 Jan-Aug 2009: down 20.0%
MERCEDES-BENZ: 596 Jan-Aug 2008 – 603 Jan-Aug 2009: up 1.0%
MITSUBISHI: 3174 Jan-Aug 2008 – 1281 Jan-Aug 2009: down 60.0%
NISSAN: 2236 Jan-Aug 2008 – 1786 Jan-Aug 2009: down 20.0%
SUBARU: 1149 Jan-Aug 2008 – 927 Jan-Aug 2009L down 19.0%
SUZUKI: 3929 Jan-Aug 2008 – 2421 Jan-Aug 2009: down 38.0%
TOYOTA: 8575 Jan-Aug 2008 – 5698 Jan-Aug 2009: down 33.0%
VOLKSWAGEN: 1317 Jan-Aug 2008 – 1132 Jan-Aug 2009: down 14.0%
